

Bowtie Analysis
Bowtie Analysis is a simple method to identify where new or enhanced controls may be worthwhile. It is a vital part of risk treatment planning, especially where there is a high level of risk or where control effectiveness is evaluated as low.
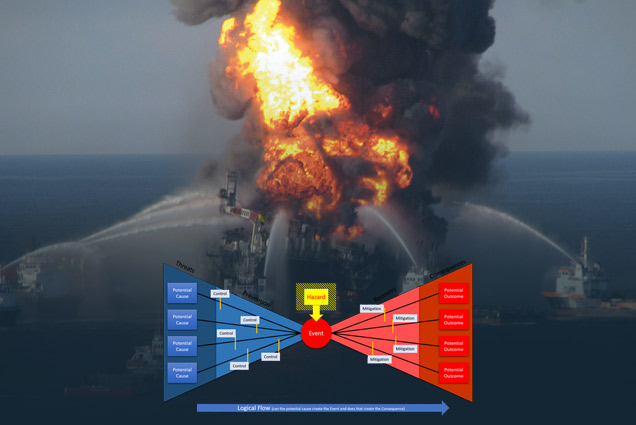
A bow tie diagram provides a visual representation of all credible accident scenarios that could exist around a certain hazard. It links threats and consequences to an event that are controlled by various prevention as well as recovery measures (barriers).
A bow tie is a graphical description of pathways from the causes of a risk or an event to its consequences in a simple qualitative cause-consequence diagram. It is a simplified mixture of a fault tree that evaluates the cause of a risk or an event, the left-hand side of the diagram, and an event tree that evaluates the consequences, the right-hand side.
The focal point of bow tie analysis is on the barriers or controls described to the left-hand side of the knot that can change the likelihood of the circumstance or event, or on those on the right-hand side that can change its consequences.
Benefits of Bow Tie Analysis
Highly productive for initial Process Hazard Analysis.
Assures identification of high probability-high consequence events.
Amalgamated application of a high-level fault/event trees.
Representation of the causes of a hazardous scenario event, likely outcomes, and the measures in place to avoid, reduce, or control hazards.
Existing safeguards (barriers) are identified and assessed.
Usual cause scenarios are recognized and described on the pre-event side (left side) of the bow-tie diagram.
Credible consequences and scenario outcomes are described on the post-event side (right side) of the diagram.
Associated barrier safeguards are involved.
Insights

 Best Practices")


Case Studies


-
Comprehensive Risk Analysis – Handling & Disposal of Crude Oil Sludge T-280 at Mubarraz Island
Dhafir Technologies LLC
UAE
2022
-
MACE- Safety Awareness Training for Rigger
MACE
UAE
2020
-
Safety Awareness Training
MACE
UAE
2020
-
Carrying Out a Technical Assessment and Drawing Up a Program to Bring GPDF Facilities into Compliance in Terms of: Lot 1 – Prevention of Industrial Risks & Lot 2 – Environmental Protection as part of Sustainable Development
SONATRACH-GPDF
ALGERIA
2025