[vc_row css=”.vc_custom_1628683571801{margin-bottom: 53px !important;}”][vc_column]

[/vc_column][/vc_row][vc_row][vc_column][vc_custom_heading stm_title_font_weight=”700″ text=”Bow Tie Analysis” font_container=”tag:h1|font_size:45px|text_align:center|line_height:60px” use_theme_fonts=”yes” css=”.vc_custom_1629553769760{margin-bottom: 30px !important;}”][/vc_column][/vc_row][vc_row css=”.vc_custom_1626687026712{margin-bottom: 51px !important;}”][vc_column][vc_column_text css=”.vc_custom_1637223700111{margin-bottom: 25px !important;}”]
BowTie
Bow Tie Analysis

Bow Tie Analysis is a simple method to identify where new or enhanced controls may be worthwhile. It is a vital part of risk treatment planning, especially where there is a high level of risk or where control effectiveness is evaluated as low.

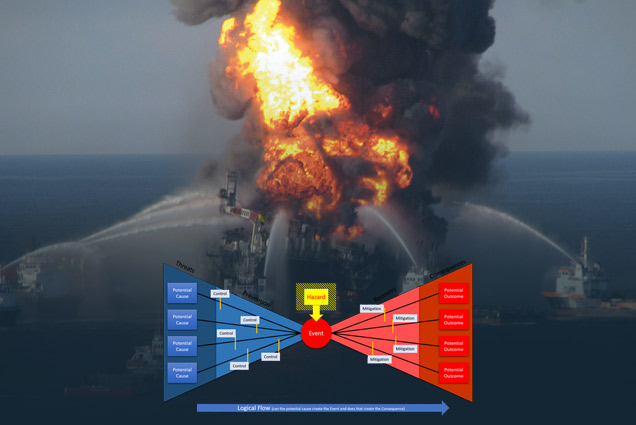
A bow tie diagram provides a visual representation of all credible accident scenarios that could exist around a certain hazard. It links threats and consequences to an event that are controlled by various prevention as well as recovery measures (barriers).

A bow tie is a graphical description of pathways from the causes of a risk or an event to its consequences in a simple qualitative cause-consequence diagram. It is a simplified mixture of a fault tree that evaluates the cause of a risk or an event, the left-hand side of the diagram, and an event tree that evaluates the consequences, the right-hand side.

The focal point of bow tie analysis is on the barriers or controls described to the left-hand side of the knot that can change the likelihood of the circumstance or event, or on those on the right-hand side that can change its consequences.

[/vc_column_text][stm_spacing lg_spacing=”0″ md_spacing=”0″ sm_spacing=”0″ xs_spacing=”30″][/vc_column][/vc_row][vc_row full_width=”stretch_row” css=”.vc_custom_1452840284250{padding-top: 47px !important;padding-bottom: 18px !important;background-color: #f2f2f2 !important;}”][vc_column][vc_custom_heading text=”Benefits of Bow Tie Analysis” font_container=”tag:h2|text_align:center” use_theme_fonts=”yes” css=”.vc_custom_1629553805120{margin-bottom: 40px !important;}”][vc_row_inner css=”.vc_custom_1452839824807{margin-bottom: 27px !important;}”][vc_column_inner width=”1/2″][stm_icon_box hide_title_line=”hide_title_line” icon=”stm-worldwide-shipping” style=”icon_left” icon_size=”26″ icon_color=”base” icon_bg_color=”third_bg” icon_width=”70″ title=”Highly productive for initial Process Hazard Analysis.”][/stm_icon_box][/vc_column_inner][vc_column_inner width=”1/2″][stm_icon_box hide_title_line=”hide_title_line” icon=”stm-tick” style=”icon_left” icon_size=”30″ icon_color=”base” icon_bg_color=”third_bg” icon_width=”70″ title=”Assures identification of high probability-high consequence events.”][/stm_icon_box][/vc_column_inner][/vc_row_inner][vc_row_inner css=”.vc_custom_1452839938467{margin-bottom: 27px !important;}”][vc_column_inner width=”1/2″][stm_icon_box hide_title_line=”hide_title_line” icon=”stm-online-work” style=”icon_left” icon_size=”23″ icon_color=”base” icon_bg_color=”third_bg” icon_width=”70″ title=”Amalgamated application of a high-level fault/event trees.”][/stm_icon_box][/vc_column_inner][vc_column_inner width=”1/2″][stm_icon_box hide_title_line=”hide_title_line” icon=”stm-glob-shield” style=”icon_left” icon_size=”23″ icon_color=”base” icon_bg_color=”third_bg” icon_width=”70″ title=”Representation of the causes of a hazardous scenario event, likely outcomes, and the measures in place to avoid, reduce, or control hazards.”][/stm_icon_box][/vc_column_inner][/vc_row_inner][vc_row_inner css=”.vc_custom_1452839938467{margin-bottom: 27px !important;}”][vc_column_inner width=”1/2″][stm_icon_box hide_title_line=”hide_title_line” icon=”stm-glob-pie-chart” style=”icon_left” icon_size=”28″ icon_color=”base” icon_bg_color=”third_bg” icon_width=”70″ title=”Existing safeguards (barriers) are identified and assessed.”][/stm_icon_box][/vc_column_inner][vc_column_inner width=”1/2″][stm_icon_box hide_title_line=”hide_title_line” icon=”stm-glob-pie-chart” style=”icon_left” icon_size=”22″ icon_color=”base” icon_bg_color=”third_bg” icon_width=”70″ title=”Usual cause scenarios are recognized and described on the pre-event side (left side) of the bow-tie diagram.”][/stm_icon_box][/vc_column_inner][/vc_row_inner][vc_row_inner css=”.vc_custom_1452839938467{margin-bottom: 27px !important;}”][vc_column_inner width=”1/2″][stm_icon_box hide_title_line=”hide_title_line” icon=”stm-lnr-chevron-right” style=”icon_left” icon_size=”28″ icon_color=”base” icon_bg_color=”third_bg” icon_width=”70″ title=”Credible consequences and scenario outcomes are described on the post-event side (right side) of the diagram.”][/stm_icon_box][/vc_column_inner][vc_column_inner width=”1/2″][stm_icon_box hide_title_line=”hide_title_line” icon=”stm-lnr-refresh” style=”icon_left” icon_size=”22″ icon_color=”base” icon_bg_color=”third_bg” icon_width=”70″ title=”Associated barrier safeguards are involved.”][/stm_icon_box][/vc_column_inner][/vc_row_inner][/vc_column][/vc_row][vc_row full_width=”stretch_row” css=”.vc_custom_1633666962216{padding-top: 47px !important;padding-bottom: 60px !important;background-image: url(http://consulting.stylemixthemes.com/demo/wp-content/uploads/sites/2/2016/01/service_parallax-1.jpg?id=593) !important;background-position: center !important;background-repeat: no-repeat !important;background-size: cover !important;}” el_class=”overlay_4 fixed_bg service_info_box”][vc_column][vc_row_inner][vc_column_inner width=”1/3″][stm_info_box align_center=”yes” style=”style_2″ css=”.vc_custom_1646109964502{padding-top: 10px !important;padding-right: 20px !important;padding-bottom: 36px !important;padding-left: 20px !important;}”]

[/stm_info_box][/vc_column_inner][vc_column_inner width=”1/3″][stm_info_box align_center=”yes” style=”style_2″ css=”.vc_custom_1646109976518{padding-top: 10px !important;padding-right: 20px !important;padding-bottom: 36px !important;padding-left: 20px !important;}”]

[/stm_info_box][/vc_column_inner][vc_column_inner width=”1/3″][stm_info_box align_center=”yes” style=”style_2″ css=”.vc_custom_1646109987629{padding-top: 10px !important;padding-right: 20px !important;padding-bottom: 36px !important;padding-left: 20px !important;}”]

[/stm_info_box][/vc_column_inner][/vc_row_inner][/vc_column][/vc_row][vc_row full_width=”stretch_row” parallax=”content-moving” parallax_image=”16629″ css=”.vc_custom_1706772058363{margin-bottom: -60px !important;padding-top: 82px !important;padding-bottom: 125px !important;}” el_class=”video_overlay”][vc_column el_class=” “][vc_btn title=”Download Brochure” style=”flat” shape=”square” color=”theme_style_3″ size=”lg” align=”center” i_align=”right” i_icon_fontawesome=”fas fa-chevron-right” add_icon=”true” link=”url:https%3A%2F%2Fvelosiaims.com%2Fwp-content%2Fuploads%2F2019%2F09%2FVelosi-Company-Profile.pdf”][/vc_column][/vc_row][vc_row css=”.vc_custom_1629115315253{margin-top: 100px !important;margin-bottom: 31px !important;}”][vc_column][vc_custom_heading text=”Insights” font_container=”tag:h2|font_size:45px|text_align:center” use_theme_fonts=”yes”][/vc_column][/vc_row][vc_row css=”.vc_custom_1628590799794{margin-bottom: 32px !important;}” el_class=”latest_news_section”][vc_column][stm_news posts_per_row=”4″ view_style=”style_2″][/vc_column][/vc_row][vc_row css=”.vc_custom_1629115480743{margin-top: 20px !important;margin-bottom: 31px !important;}”][vc_column][vc_custom_heading text=”Case Studies” font_container=”tag:h2|font_size:45px|text_align:center” use_theme_fonts=”yes”][/vc_column][/vc_row][vc_row css=”.vc_custom_1628590816966{margin-bottom: 32px !important;}” el_class=”latest_news_section”][vc_column][stm_news loop=”size:4|post_type:stm_works|tax_query:79″ posts_per_row=”4″ view_style=”style_2″][/vc_column][/vc_row]